UV/vis refractive index
In this section we provide technical details on how to explore the IR spectrum of ices within the Leiden Ice database.
Bokeh plot of the UV/vis refractive index
As used in the case of IR spectrum, Bokeh is also adopted to show the plots of UV.vis refractive index.
Bokeh is used to provide interactive visualization of IR spectra in the Leiden Ice Database. A series of options are further detailed below:
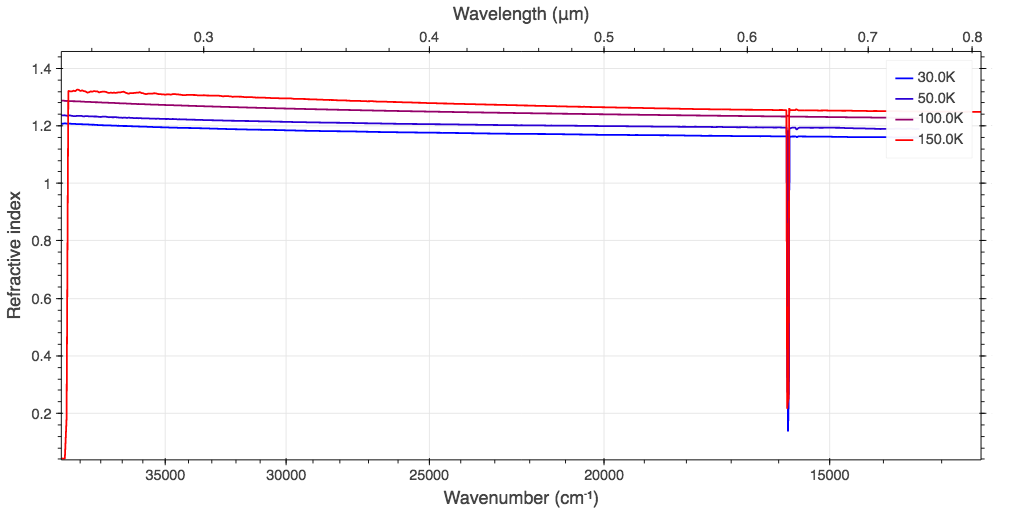
Refractive index of H2O at different temperatures. The artifact at 0.64 microns is due to interference with the HeNe laser.
Data point information
A hover dynamically shows information for each datapoint, e.g., wavenumber, wavelength and refractive index. Also, the refractive index at different temperatures are highlighted by passing the hover across them.
Interactive legend
Another interesting feature from Bokeh is the interactive legend. By clicking on the temperature values, the user can hide the spectra and click again to show the refractive index.
Toolbar
The toolbar on the right side provides further options to interact with the plot. Among the options, the user can zoom-in and zoom-out one specific region of the plot. Wheel zoom is also available in this plot that is centered on the cursor position. All the changes can be saved using the floppy icon or restored to the original plot with the circle icon.
Download data
All the spectra in the database are available for download in ASCII format. Each spectrum can be downloaded separately or all together in a zip file.
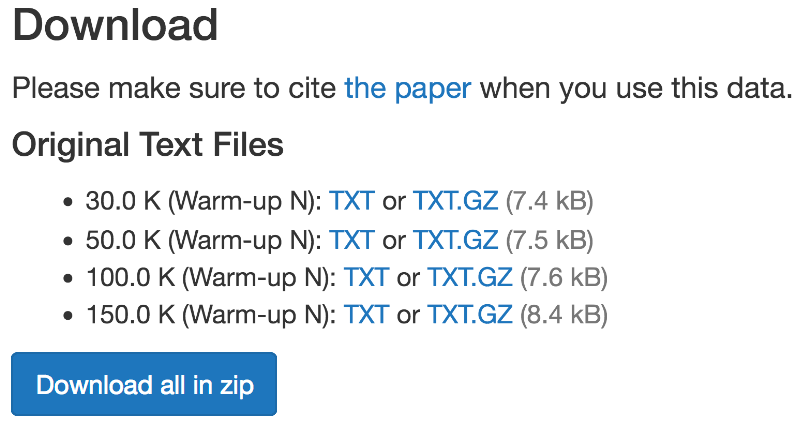
Example of the download section for obtaining the data from the database.