3D molecule viewer
This section is dedicated to show how to manipulate the 3D molecule viewer inside the Leiden Ice Database. The viewer used the Jmol package.
Note
The Jmol interactive documentation can be found here.
Featured capabilities
Figure 1 displays the 3D molecule viewer window. The user can move the 3D model of the molecule shown in the left side of the viewer.

Figure 1: 3D molecule viewer window. The left side shows the 3D model of the molecule and the searching feature. The right side makes available dedicated controls to manipulate the molecule.
The atom colour adopts the CPK colour scheme that is indicated in Figure 2. Source in this link.

Figure 2: Atom color code used in the 3D molecule viewer.
Searching capability
The searching capability on the left side allows the user to search and visualize other molecules that are not necessarily linked to the ice spectrum in the database. By default, this viewer is connected with the public databases of molecule called PubChem. For this, the user must type the colon symbol and the name of the molecule, as for example:
:methanol
After the command above, the viewer will show the 3D model of CH3OH molecule as indicated in Figure 3.

Figure 3: 3D model of methanol using the searching capability.
Dedicated controls
To make easier to control some aspects of the 3D molecule model, a few dedicated controls are available in the right side of the viewer. Some of these buttons allow to control the animation of the vibrational modes of the molecule.
Note
The buttons vibration, vectors, color vector yellow, color vector cyan, vector scale 1.0 and vector scale 0.5 are only activated when a file is upload with the button Load a file to show vibrational modes.
The field list below describes the function of the buttons:
- Load a file to show vibrational modes
A file can be uploaded to the viewer containing the information of the vibrational modes. More about this file is given in Vibrational modes.
- vibration
This button activated by default. It enables the animation of the molecule when the file is uploaded. When deactivated, the vibrational mode animation stops.
- vectors
The direction of the vibrational mode of a certain functional group is shown by clinking on this button.
- color vectors yellow
Turns the color of the vibrational modes to yellow.
- color vectors cyan
Turns the color of the vibrational modes to cyan.
- vector scale 1.0
Set the size vector to a scale of 1.0.
- vector scale 0.5
Set the size vector to a scale of 0.5.
- spacefill 15%
Shows the size of the atoms (balls) in 15%.
- spacefill 20%
Shows the size of the atoms (balls) in 20% (default).
- wireframe on
Reduce the size of the bonds and shows only wires.
- wireframe 0.1
Size of the bonds scaled to 0.1 (default).
- spin
Rotates the molecule in an animation mode.
Vibrational modes
The vibrational modes of the molecules hosted in the Leiden Ice Database are calculated with the ORCA software. The goal of this feature is to show the animation of the functional group associated with the vibrational mode, rather than the accuracy of the frequency of the transition. The information of the vibrational modes are available at the GitHub page of the Leiden Ice Database. The files have extension .xyz.
By clicking on the button Load a file to show vibrational modes, the user can upload the .xyz file, and the animation will start automatically. Figure 4 shows a snapshot of the bending mode of H2O ice.
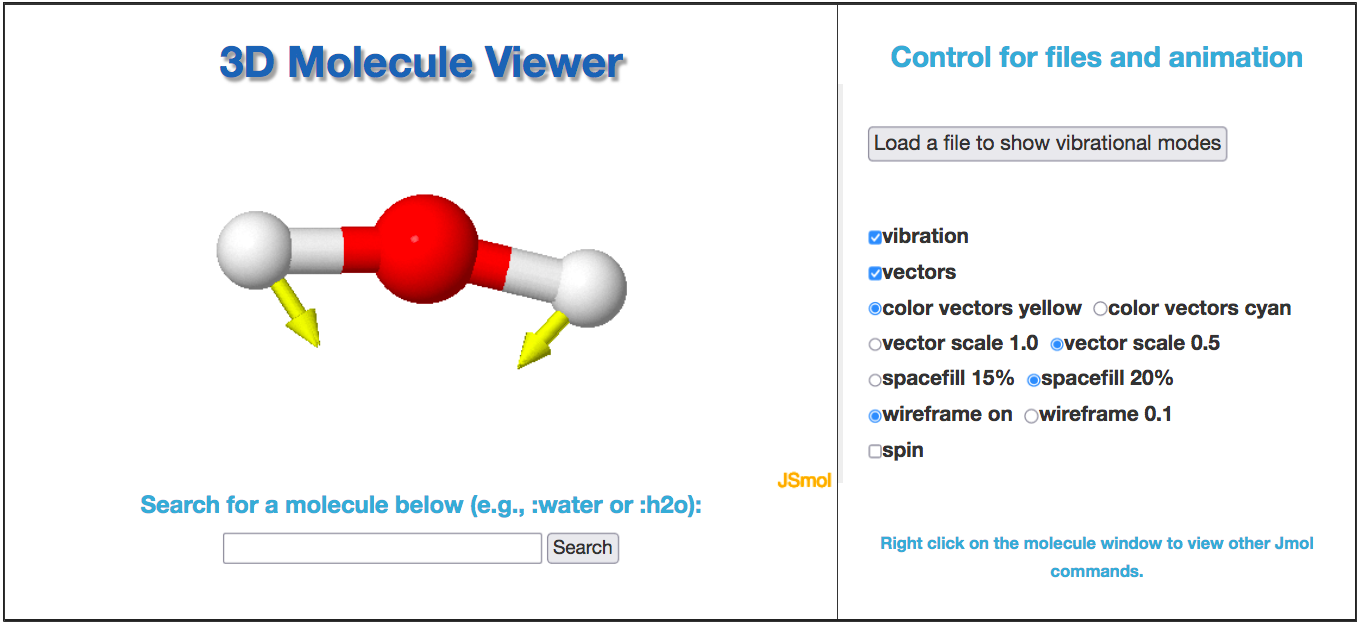
Figure 4: Snapshot of the H2O bending mode.
Dipole moment
Several commands are available by right clicking on the JSmol icon on the bottom right corner close to the 3D molecule model. One of these options is the capability to show the dipole moment of the molecule, an important feature in the context of IR spectroscopy.
To enable the dipole moment visualization, the user have to open the console option by right clicking on the JSmol icon, and moving the cursor to the console option. Next, the dipole bond can be visualized by running the command below:
dipole bonds
To delete the vectors, use:
dipole bonds delete
Individual vectors can also be visualized with the command (e.g., between atoms 1 and 3):
dipole (atomno=1) (atomno=3)
The molecular dipole can also be visualized with the command:
dipole molecular